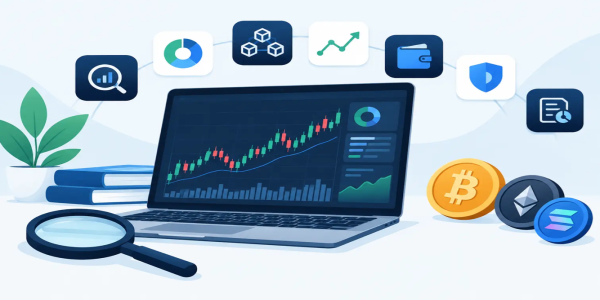
7 Token Research Tools for Smarter Crypto Trades
Compare token research tools that help you assess liquidity, holders, tokenomics, contracts, and momentum before you risk capital in volatile markets.
A token can surge 40% before breakfast and disappear from the conversation by lunch. That speed is exactly why token research tools matter. They give you a clearer view of what sits behind the ticker: the contract, the liquidity, the holders, the supply, and the behavior driving the chart.
Fast access to crypto creates opportunity, but speed without context can turn a promising trade into an expensive lesson. You do not need an institutional research desk to investigate a token. You need a repeatable process, the right data sources, and the discipline to walk away when the facts do not support the story.
What Token Research Tools Should Show You
The best research setup answers a simple question: can this token be bought, sold, and held without relying on hype alone? Price is only one part of that answer. A green chart may reflect genuine demand, a thin liquidity pool, a single large buyer, or a temporary social-media push.
Look for tools that reveal on-chain activity, market structure, supply distribution, and contract behavior. No individual metric proves that a project is strong or weak. The value comes from comparing the signals. A token with rising volume, stable liquidity, diversified ownership, and transparent development tells a very different story from one with a dramatic chart and no depth behind it.
Research does not remove risk. Crypto markets are volatile, token data can change quickly, and malicious contracts exist. Still, a five-minute review can expose risks that a price chart will never show.
7 Token Research Tools Worth Using
1. Price and charting dashboards
Start with price action, but do not stop there. Charting dashboards show the current price, trading volume, market capitalization, fully diluted valuation, price history, and exchange or pool activity. Use them to understand whether a move is gaining momentum or simply reacting to a sudden burst of speculation.
Compare short-term volume with average volume. If the price is climbing while volume is weak, the move may not have much support. If volume spikes sharply but fades immediately, traders may be exiting as quickly as they entered. Charts show behavior, not intent, so treat them as the first screen rather than the final decision.
2. Block explorers
A block explorer is where a token becomes more than a logo and a ticker. It lets you inspect the contract address, total supply, transfers, holders, contract verification status, and wallet movements directly on the network.
Always confirm that you are looking at the correct contract address. Scam tokens often copy a legitimate name and symbol. Once you have the right address, review the largest holders. If a few wallets control most of the supply, they can create major selling pressure at any time. Large allocations are not automatically a deal-breaker, but they demand an explanation.
3. Liquidity and decentralized exchange analytics
Liquidity determines whether you can enter or exit a trade at something close to the displayed price. A token may show an attractive market cap, but if its liquidity is thin, even a modest order can create serious slippage.
Use decentralized exchange analytics to check the size of the liquidity pool, recent trades, pool age, trading pairs, and liquidity changes. Watch for liquidity that was added yesterday and can be removed tomorrow. A rapidly growing pool can signal rising interest, while a shrinking pool can signal that flexibility is disappearing when you may need it most.
4. Tokenomics trackers
Tokenomics explains how supply enters the market and who may receive it. Research tools in this category help you review circulating supply, maximum supply, emissions, vesting schedules, unlock dates, treasury allocations, and team or investor holdings.
This matters because a token can look inexpensive while carrying a much higher fully diluted valuation. If only a small percentage of tokens are circulating, future unlocks may increase selling pressure. On the other hand, controlled unlocks tied to real network growth can be reasonable. The question is whether the supply schedule is transparent and whether the market has time to absorb it.
5. Holder and wallet analytics
Holder data puts ownership concentration into perspective. Beyond the top-wallet list, wallet analytics can reveal whether holders are growing, whether large wallets are accumulating or distributing, and whether activity comes from many independent users or a tight cluster of related addresses.
Be careful with raw percentages. Exchange wallets, liquidity pools, burn addresses, and staking contracts can appear among the largest holders. Identify what each major address represents before assuming that a token is centralized. The useful signal is not simply that whales exist. It is whether ownership and trading behavior make the token vulnerable to a sudden one-sided move.
6. Contract scanners and security checkers
A token contract can include rules that affect your ability to trade. Contract scanners look for common risks such as hidden minting permissions, excessive transaction taxes, blacklists, paused transfers, ownership controls, and functions that allow an issuer to change the rules.
Automated checks are a warning system, not a guarantee of safety. A clean scanner result does not prove a project is legitimate, and a flagged permission may have a valid technical reason. Read the risk details. If you cannot understand what a critical function does, that is a reason to reduce exposure or skip the trade.
7. Community and development activity trackers
Crypto is built around networks, and real networks leave evidence. Community and development trackers can help you review public updates, contributor activity, governance participation, product releases, and how consistently a project communicates with users.
Do not confuse a large follower count with traction. Engagement can be purchased, and loud communities can disappear overnight. Look for specifics: working products, measurable milestones, thoughtful responses to technical questions, and communication that stays consistent when price action turns negative.
Build a Fast Research Routine Before You Trade
A practical workflow does not need to slow you down. Begin by copying the token contract address from a trusted source and verifying it in a block explorer. Check the chain, the contract status, the token supply, and the largest holders.
Next, review the chart and liquidity. Ask whether volume is broad enough to support your position size and whether the pool has enough depth for a clean exit. Then inspect tokenomics for upcoming unlocks or a large gap between circulating and fully diluted value.
Finish with contract risk checks and a quick review of the project's activity. If several warning signs appear at once - concentrated holders, shallow liquidity, unclear supply, and powerful contract permissions - do not let a fast-moving chart pressure you into action. Missing one trade is usually cheaper than forcing a bad one.
For active traders, save this process as a pre-trade checklist. The goal is not to predict every move. The goal is to avoid entering a position without knowing what can break it.
Signals That Deserve a Second Look
Some situations call for extra caution rather than an immediate yes or no. A newly launched token may have limited history, which makes it harder to judge authentic demand. A meme token may have no traditional fundamentals but still attract strong liquidity and an active community. A token with concentrated ownership may be connected to staking or treasury wallets rather than private whale wallets.
Context matters. What should not change is your standard for verification. If the contract address is unclear, the liquidity is too low for your trade, or the supply details cannot be confirmed, the trade does not need to happen today.
Budrigan Market gives traders a direct route to a broad range of digital assets, but the decision to buy remains yours. Use research to choose positions with intention, protect your capital with position sizing, and keep control of the process from first scan to final exit.
The market will always offer another chart, another narrative, and another chance to act. Your advantage is having the confidence to move when the data supports you - and the discipline to stay out when it does not.
Share This Post
Recent Posts
-

-
Stablecoin Settlement Options for Faster Trading
01 Nov 2026
-
10 Best Blockchain Security Habits for Traders
01 Nov 2026
-
Wallet Phishing Attack Example: Spot the Trap
01 Nov 2026
-
Wallet Backup Methods That Keep Crypto in Reach
26 Oct 2026